kwimage.im_draw module
- kwimage.im_draw._draw_text_on_image_pil(img, text, org=None, fontpath=None, fontsize=32)[source]
PIL backend.
Todo
- [ ] Abstract draw_text_on_image to have an opencv and PIL backend.
OpenCV can’t do unicode, but PIL needs an external font file. However, PIL seems to have a much prettier result, we may want to use that as the default.
References
- kwimage.im_draw.draw_text_on_image(img, text, org=None, return_info=False, **kwargs)[source]
Draws multiline text on an image using opencv
- Parameters:
img (ndarray | None | dict) – Generally a numpy image to draw on (inplace). Otherwise a canvas will be constructed such that the text will fit. The user may specify a dictionary with keys width and height to have more control over the constructed canvas.
text (str) – text to draw
org (Tuple[int, int]) – The x, y location of the text string “anchor” in the image as specified by halign and valign. For instance, If valign=’bottom’, halign=’left’, this where the bottom left corner of the text will be placed.
return_info (bool) – if True, also returns information about the positions the text was drawn on.
**kwargs – color (tuple): default blue
thickness (int): defaults to 2
fontFace (int): defaults to cv2.FONT_HERSHEY_SIMPLEX
fontScale (float): defaults to 1.0
valign (str): either top, center, or bottom. Defaults to “bottom” NOTE: this default may change to “top” in the future.
halign (str): either left, center, or right. Defaults to “left”.
border (dict | int): If specified as an integer, draws a black border with that given thickness. If specified as a dictionary, draws a border with color specified parameters. “color”: border color, defaults to “black”. “thickness”: border thickness, defaults to 1.
- Returns:
The image that was drawn on and optionally an information dictionary if return_info was True.
- Return type:
ndarray | Tuple[ndarray, dict]
Note
The image is modified inplace. If the image is non-contiguous then this returns a UMat instead of a ndarray, so be careful with that.
- Related:
The logic in this function is related to the following stack overflow posts [SO27647424] [SO51285616]
References
Example
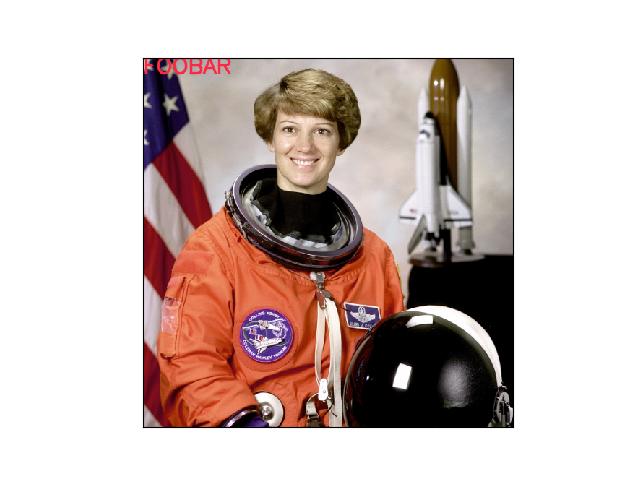
>>> import kwimage
>>> img = kwimage.grab_test_image(space='rgb')
>>> img2 = kwimage.draw_text_on_image(img.copy(), 'FOOBAR', org=(0, 0), valign='top')
>>> assert img2.shape == img.shape
>>> assert np.any(img2 != img)
>>> # xdoctest: +REQUIRES(--show)
>>> import kwplot
>>> kwplot.autompl()
>>> kwplot.imshow(img2)
>>> kwplot.show_if_requested()
Example
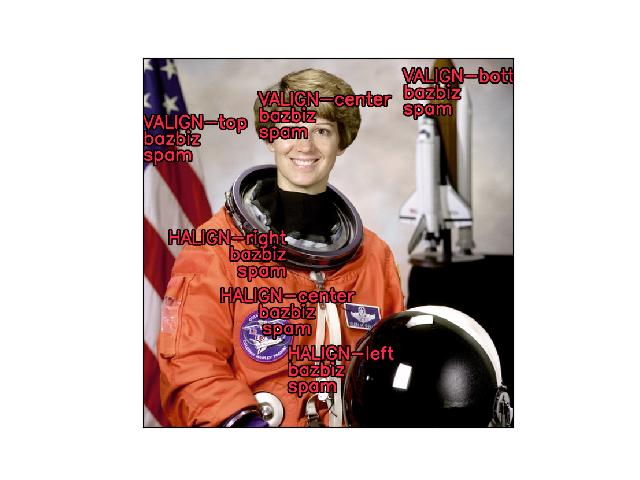
>>> import kwimage
>>> # Test valign
>>> img = kwimage.grab_test_image(space='rgb', dsize=(640, 640))
>>> img2 = kwimage.draw_text_on_image(img, 'VALIGN-top\nbazbiz\nspam', org=(0, 100), valign='top', border=2)
>>> img2 = kwimage.draw_text_on_image(img, 'VALIGN-center\nbazbiz\nspam', org=(200, 100), valign='center', border=2)
>>> img2 = kwimage.draw_text_on_image(img, 'VALIGN-bottom\nbazbiz\nspam', org=(450, 100), valign='bottom', border=2)
>>> # Test halign
>>> img2 = kwimage.draw_text_on_image(img, 'HALIGN-right\nbazbiz\nspam', org=(250, 300), halign='right', border=2)
>>> img2 = kwimage.draw_text_on_image(img, 'HALIGN-center\nbazbiz\nspam', org=(250, 400), halign='center', border=2)
>>> img2 = kwimage.draw_text_on_image(img, 'HALIGN-left\nbazbiz\nspam', org=(250, 500), halign='left', border=2)
>>> # xdoctest: +REQUIRES(--show)
>>> import kwplot
>>> kwplot.autompl()
>>> kwplot.imshow(img2)
>>> kwplot.show_if_requested()
Example
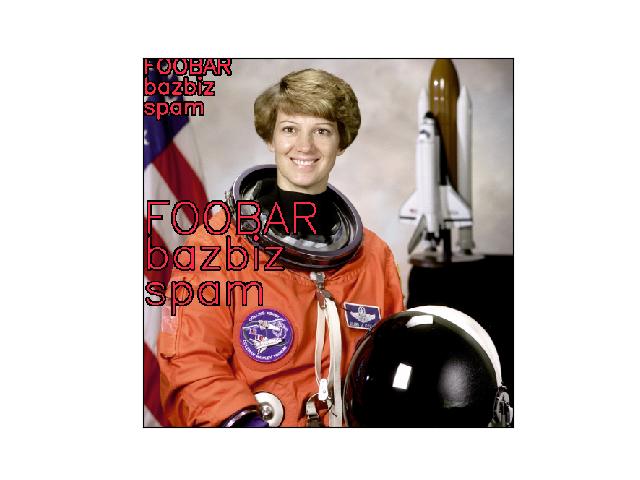
>>> # Ensure the function works with float01 or uint255 images
>>> import kwimage
>>> img = kwimage.grab_test_image(space='rgb')
>>> img = kwimage.ensure_float01(img)
>>> img2 = img.copy()
>>> img2 = kwimage.draw_text_on_image(img2, 'FOOBAR\nbazbiz\nspam', org=(0, 0), valign='top', border=2, fontScale=1.0)
>>> img2 = kwimage.draw_text_on_image(img2, 'FOOBAR\nbazbiz\nspam', org=(0, 200), valign='top', border=2, fontScale=2.0)
>>> # xdoctest: +REQUIRES(--show)
>>> import kwplot
>>> kwplot.autompl()
>>> kwplot.imshow(img2)
>>> kwplot.show_if_requested()
Example
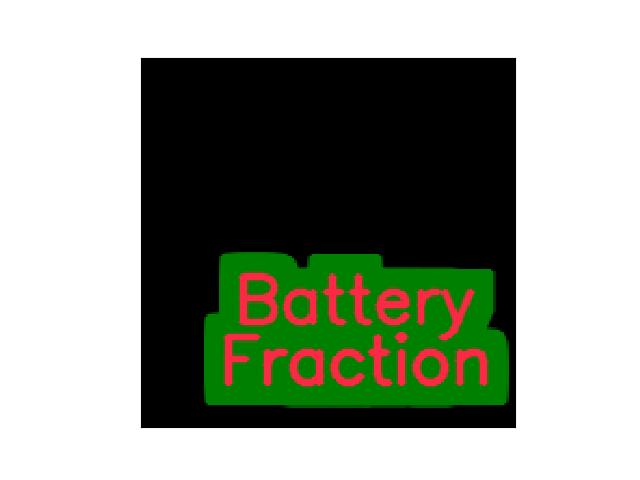
>>> # Test dictionary border
>>> import kwimage
>>> img = kwimage.draw_text_on_image(None, 'Battery\nFraction', org=(100, 100), valign='top', halign='center', border={'color': 'green', 'thickness': 9})
>>> #img = kwimage.draw_text_on_image(None, 'hello\neveryone', org=(0, 0), valign='top')
>>> #img = kwimage.draw_text_on_image(None, 'hello', org=(0, 60), valign='top', halign='center', border=0)
>>> # xdoctest: +REQUIRES(--show)
>>> import kwplot
>>> kwplot.autompl()
>>> kwplot.imshow(img)
>>> kwplot.show_if_requested()
Example
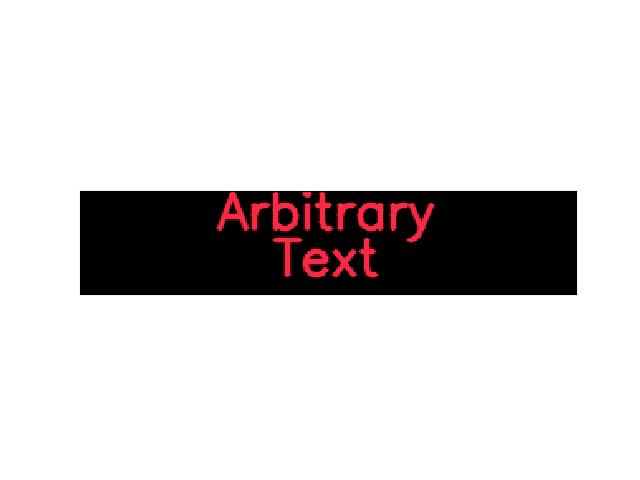
>>> # Test dictionary image
>>> import kwimage
>>> img = kwimage.draw_text_on_image({'width': 300}, 'Arbitrary\nText', org=(150, 0), valign='top', halign='center', border={'color': 'green', 'thickness': 0})
>>> print('img.shape = {!r}'.format(img.shape))
>>> # xdoctest: +REQUIRES(--show)
>>> import kwplot
>>> kwplot.autompl()
>>> kwplot.imshow(img)
>>> kwplot.show_if_requested()
Example
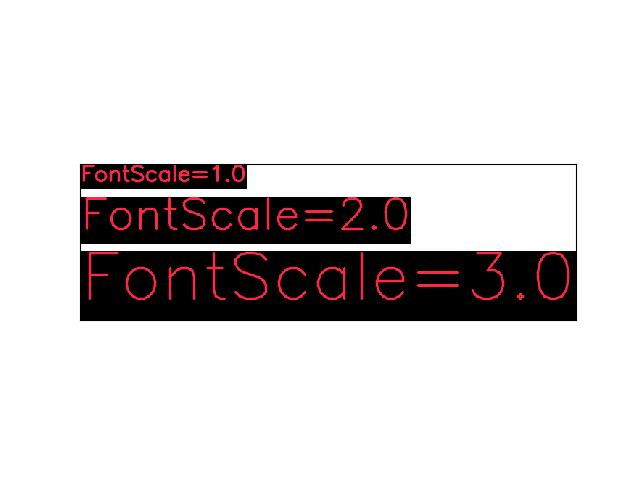
>>> # Test fontScale
>>> import kwimage
>>> canvases = []
>>> canvases.append(kwimage.draw_text_on_image(None, 'FontScale=1.0', fontScale=1.0))
>>> canvases.append(kwimage.draw_text_on_image(None, 'FontScale=2.0', fontScale=2.0))
>>> canvases.append(kwimage.draw_text_on_image(None, 'FontScale=3.0', fontScale=3.0))
>>> # xdoctest: +REQUIRES(--show)
>>> canvas = kwimage.stack_images_grid(canvases, pad=10, bg_value=(255, 255, 255))
>>> import kwplot
>>> kwplot.autompl()
>>> kwplot.imshow(canvas)
>>> kwplot.show_if_requested()
Example
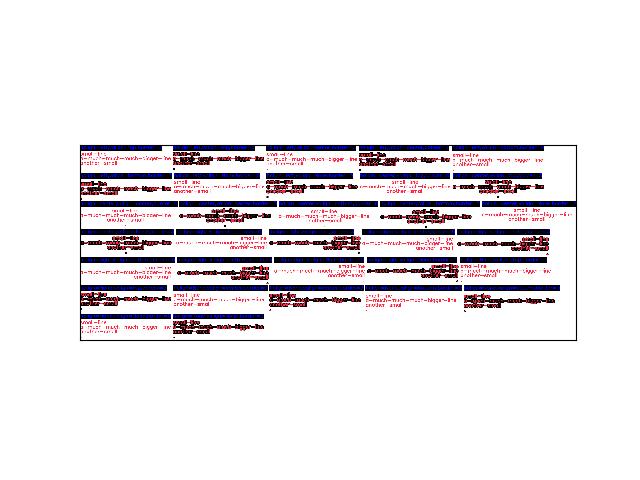
>>> import ubelt as ub
>>> import kwimage
>>> grid = list(ub.named_product({
>>>     'halign': ['left', 'center', 'right', None],
>>>     'valign': ['top', 'center', 'bottom', None],
>>>     'border': [0, 3]
>>> }))
>>> canvases = []
>>> text = 'small-line\na-much-much-much-bigger-line\nanother-small\n.'
>>> for kw in grid:
>>>     header = kwimage.draw_text_on_image({}, ub.urepr(kw, compact=1), color='blue')
>>>     canvas = kwimage.draw_text_on_image({'color': 'white'}, text, org=None, **kw)
>>>     canvases.append(kwimage.stack_images([header, canvas], axis=0, bg_value=(255, 255, 255), pad=5))
>>> # xdoctest: +REQUIRES(--show)
>>> canvas = kwimage.stack_images_grid(canvases, pad=10, bg_value=(255, 255, 255))
>>> import kwplot
>>> kwplot.autompl()
>>> kwplot.imshow(canvas)
>>> kwplot.show_if_requested()
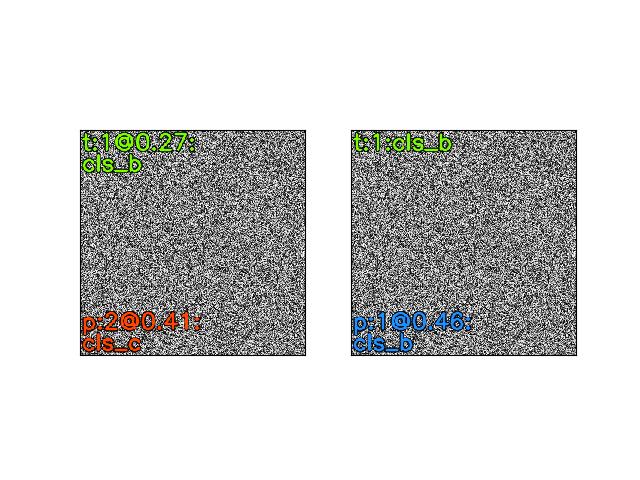
- kwimage.im_draw.draw_clf_on_image(im, classes, tcx=None, probs=None, pcx=None, border=1)[source]
Draws classification label on an image.
Works best with image chips sized between 200x200 and 500x500
- Parameters:
im (ndarray) – the image
classes (Sequence[str] | kwcoco.CategoryTree) – list of class names
tcx (int) – true class index if known
probs (ndarray) – predicted class probs for each class
pcx (int) – predicted class index. (if None but probs is specified uses argmax of probs)
Example
>>> # xdoctest: +REQUIRES(module:torch)
>>> import torch
>>> import kwarray
>>> import kwimage
>>> rng = kwarray.ensure_rng(0)
>>> im = (rng.rand(300, 300) * 255).astype(np.uint8)
>>> classes = ['cls_a', 'cls_b', 'cls_c']
>>> tcx = 1
>>> probs = rng.rand(len(classes))
>>> probs[tcx] = 0
>>> probs = torch.FloatTensor(probs).softmax(dim=0).numpy()
>>> im1_ = kwimage.draw_clf_on_image(im, classes, tcx, probs)
>>> probs[tcx] = .9
>>> probs = torch.FloatTensor(probs).softmax(dim=0).numpy()
>>> im2_ = kwimage.draw_clf_on_image(im, classes, tcx, probs)
>>> # xdoctest: +REQUIRES(--show)
>>> import kwplot
>>> kwplot.autompl()
>>> kwplot.imshow(im1_, colorspace='rgb', pnum=(1, 2, 1), fnum=1, doclf=True)
>>> kwplot.imshow(im2_, colorspace='rgb', pnum=(1, 2, 2), fnum=1)
>>> kwplot.show_if_requested()
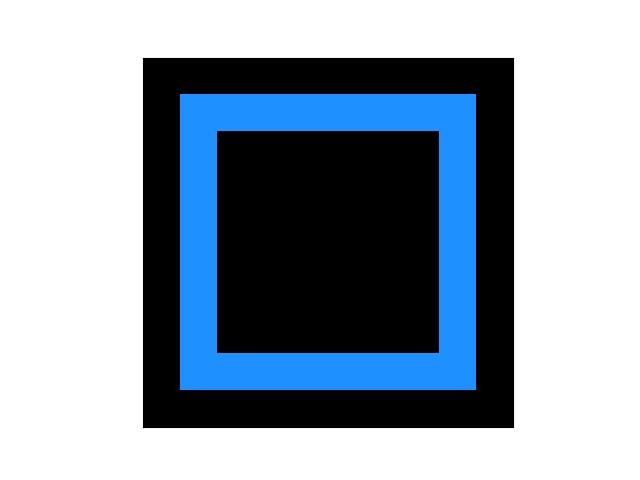
- kwimage.im_draw.draw_boxes_on_image(img, boxes, color='blue', thickness=1, box_format=None, colorspace='rgb')[source]
Draws boxes on an image.
- Parameters:
img (ndarray) – image to copy and draw on
boxes (kwimage.Boxes | ndarray) – boxes to draw
colorspace (str) – string code of the input image colorspace
Example
>>> import kwimage
>>> import numpy as np
>>> img = np.zeros((10, 10, 3), dtype=np.uint8)
>>> color = 'dodgerblue'
>>> thickness = 1
>>> boxes = kwimage.Boxes([[1, 1, 8, 8]], 'ltrb')
>>> img2 = draw_boxes_on_image(img, boxes, color, thickness)
>>> assert tuple(img2[1, 1]) == (30, 144, 255)
>>> # xdoctest: +REQUIRES(--show)
>>> import kwplot
>>> kwplot.autompl()  # xdoctest: +SKIP
>>> kwplot.figure(doclf=True, fnum=1)
>>> kwplot.imshow(img2)
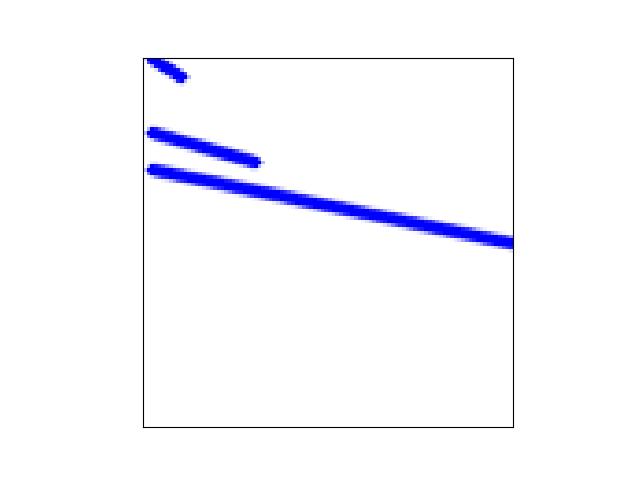
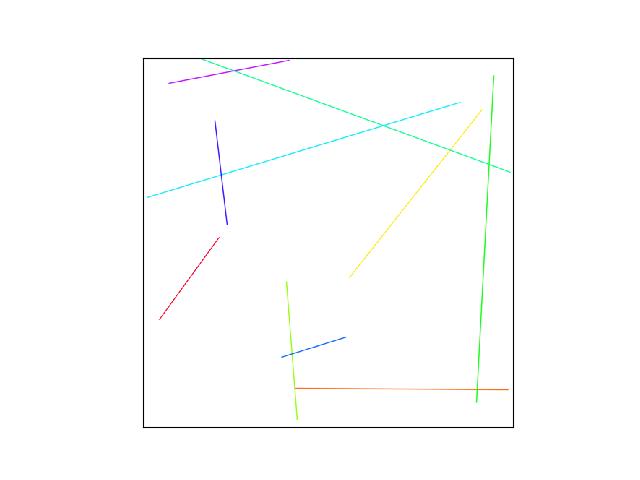
- kwimage.im_draw.draw_line_segments_on_image(img, pts1, pts2, color='blue', colorspace='rgb', thickness=1, **kwargs)[source]
Draw line segments between pts1 and pts2 on an image.
- Parameters:
pts1 (ndarray) – xy coordinates of starting points
pts2 (ndarray) – corresponding xy coordinates of ending points
color (str | List) – color code or a list of colors for each line segment
colorspace (str) – colorspace of image. Defaults to ‘rgb’
thickness (int) – Defaults to 1
lineType (int) – option for cv2.line
- Returns:
the modified image (inplace if possible)
- Return type:
ndarray
Example
>>> from kwimage.im_draw import *  # NOQA
>>> pts1 = np.array([[2, 0], [2, 20], [2.5, 30]])
>>> pts2 = np.array([[10, 5], [30, 28], [100, 50]])
>>> img = np.ones((100, 100, 3), dtype=np.uint8) * 255
>>> color = 'blue'
>>> colorspace = 'rgb'
>>> img2 = draw_line_segments_on_image(img, pts1, pts2, thickness=2)
>>> # xdoctest: +REQUIRES(--show)
>>> import kwplot
>>> kwplot.autompl()  # xdoctest: +SKIP
>>> kwplot.figure(doclf=True, fnum=1)
>>> kwplot.imshow(img2)
Example
>>> import kwimage
>>> # xdoctest: +REQUIRES(module:matplotlib)
>>> pts1 = kwimage.Points.random(10).scale(512).xy
>>> pts2 = kwimage.Points.random(10).scale(512).xy
>>> img = np.ones((512, 512, 3), dtype=np.uint8) * 255
>>> color = kwimage.Color.distinct(10)
>>> img2 = kwimage.draw_line_segments_on_image(img, pts1, pts2, color=color)
>>> # xdoctest: +REQUIRES(--show)
>>> import kwplot
>>> kwplot.autompl()  # xdoctest: +SKIP
>>> kwplot.figure(doclf=True, fnum=1)
>>> kwplot.imshow(img2)
- kwimage.im_draw._broadcast_colors(color, num, img, colorspace)[source]
Determine if color applies a single color to all
numitems, or if it is a list of colors for each item. Return as a list of colors for each item.Todo
[ ] add as classmethod of kwimage.Color
Example
>>> img = (np.random.rand(512, 512, 3) * 255).astype(np.uint8)
>>> colorspace = 'rgb'
>>> color = color_str_list = ['red', 'green', 'blue']
>>> color_str = 'red'
>>> num = 3
>>> print(_broadcast_colors(color_str_list, num, img, colorspace))
>>> print(_broadcast_colors(color_str, num, img, colorspace))
>>> colors_tuple_list = _broadcast_colors(color_str_list, num, img, colorspace)
>>> print(_broadcast_colors(colors_tuple_list, num, img, colorspace))
>>> #
>>> # FIXME: This case seems broken
>>> colors_ndarray_list = np.array(_broadcast_colors(color_str_list, num, img, colorspace))
>>> print(_broadcast_colors(colors_ndarray_list, num, img, colorspace))
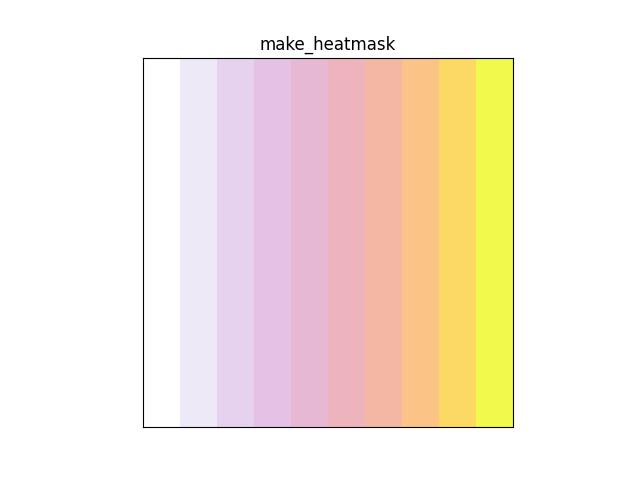
- kwimage.im_draw.make_heatmask(probs, cmap='plasma', with_alpha=1.0, space='rgb', dsize=None)[source]
Colorizes a single-channel intensity mask (with an alpha channel)
- Parameters:
probs (ndarray) – 2D probability map with values between 0 and 1
cmap (str) – mpl colormap
with_alpha (float) – between 0 and 1, uses probs as the alpha multipled by this number.
space (str) – output colorspace
dsize (tuple) – if not None, then output is resized to W,H=dsize
- SeeAlso:
kwimage.overlay_alpha_images
Example
>>> # xdoctest: +REQUIRES(module:matplotlib)
>>> from kwimage.im_draw import *  # NOQA
>>> probs = np.tile(np.linspace(0, 1, 10), (10, 1))
>>> heatmask = make_heatmask(probs, with_alpha=0.8, dsize=(100, 100))
>>> # xdoctest: +REQUIRES(--show)
>>> import kwplot
>>> kwplot.autompl()
>>> kwplot.imshow(heatmask, fnum=1, doclf=True, colorspace='rgb',
>>>               title='make_heatmask')
>>> kwplot.show_if_requested()
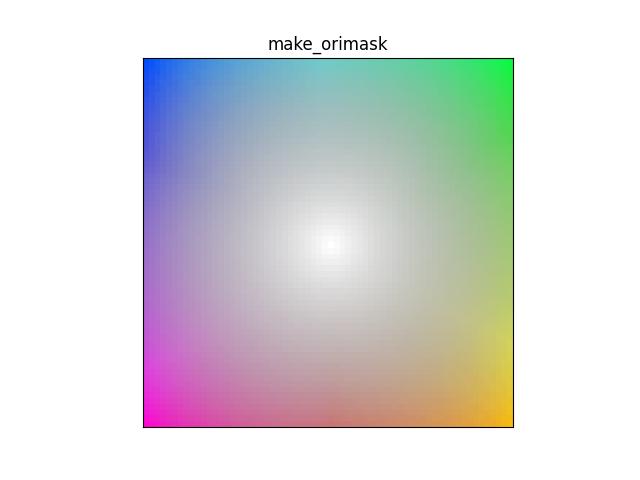
- kwimage.im_draw.make_orimask(radians, mag=None, alpha=1.0)[source]
Makes a colormap in HSV space where the orientation changes color and mag changes the saturation/value.
- Parameters:
radians (ndarray) – orientation in radians
mag (ndarray) – magnitude (must be normalized between 0 and 1)
alpha (float | ndarray) – if False or None, then the image is returned without alpha if a float, then mag is scaled by this and used as the alpha channel if an ndarray, then this is explicilty set as the alpha channel
- Returns:
an rgb / rgba image in 01 space
- Return type:
ndarray[Any, Float32]
- SeeAlso:
kwimage.overlay_alpha_images
Example
>>> # xdoctest: +REQUIRES(module:matplotlib)
>>> from kwimage.im_draw import *  # NOQA
>>> x, y = np.meshgrid(np.arange(64), np.arange(64))
>>> dx, dy = x - 32, y - 32
>>> radians = np.arctan2(dx, dy)
>>> mag = np.sqrt(dx ** 2 + dy ** 2)
>>> orimask = make_orimask(radians, mag)
>>> # xdoctest: +REQUIRES(--show)
>>> import kwplot
>>> kwplot.autompl()
>>> kwplot.imshow(orimask, fnum=1, doclf=True,
>>>               colorspace='rgb', title='make_orimask')
>>> kwplot.show_if_requested()
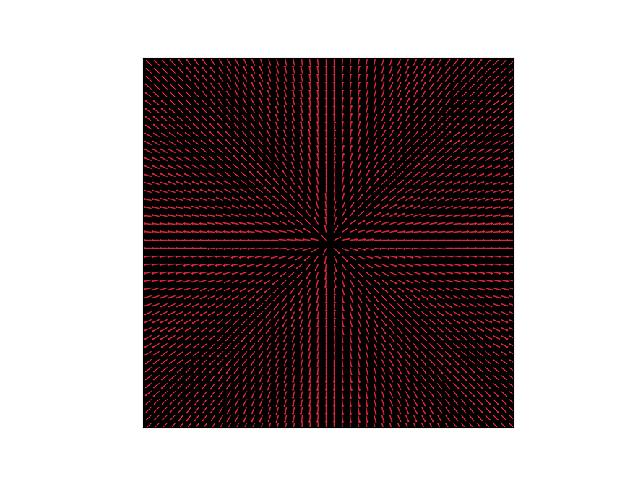
- kwimage.im_draw.make_vector_field(dx, dy, stride=0.02, thresh=0.0, scale=1.0, alpha=1.0, color='strawberry', thickness=1, tipLength=0.1, line_type='aa')[source]
Create an image representing a 2D vector field.
- Parameters:
dx (ndarray) – grid of vector x components
dy (ndarray) – grid of vector y components
stride (int | float) – sparsity of vectors, int specifies stride step in pixels, a float specifies it as a percentage.
thresh (float) – only plot vectors with magnitude greater than thres
scale (float) – multiply magnitude for easier visualization
alpha (float) – alpha value for vectors. Non-vector regions receive 0 alpha (if False, no alpha channel is used)
color (str | tuple | kwimage.Color) – RGB color of the vectors
thickness (int) – thickness of arrows
tipLength (float) – fraction of line length
line_type (int | str) – either cv2.LINE_4, cv2.LINE_8, or cv2.LINE_AA or a string code.
- Returns:
vec_img - an rgb/rgba image in 0-1 space
- Return type:
ndarray[Any, Float32]
- SeeAlso:
kwimage.overlay_alpha_images
DEPRECATED USE: draw_vector_field instead
Example
>>> x, y = np.meshgrid(np.arange(512), np.arange(512))
>>> dx, dy = x - 256.01, y - 256.01
>>> radians = np.arctan2(dx, dy)
>>> mag = np.sqrt(dx ** 2 + dy ** 2)
>>> dx, dy = dx / mag, dy / mag
>>> img = make_vector_field(dx, dy, scale=10, alpha=False)
>>> # xdoctest: +REQUIRES(--show)
>>> import kwplot
>>> kwplot.autompl()
>>> kwplot.imshow(img)
>>> kwplot.show_if_requested()
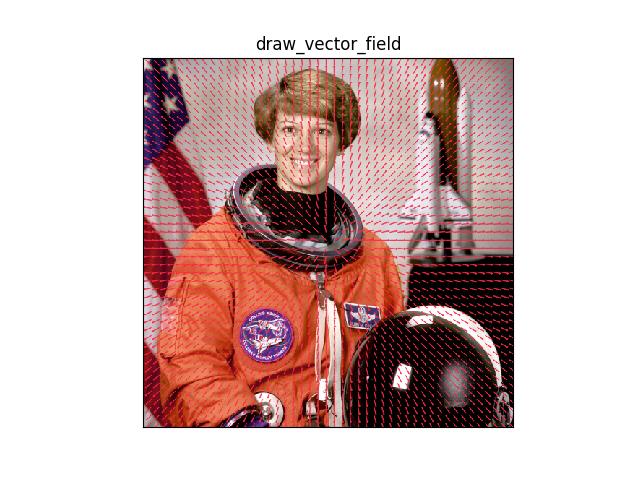
- kwimage.im_draw.draw_vector_field(image, dx, dy, stride=0.02, thresh=0.0, scale=1.0, alpha=1.0, color='strawberry', thickness=1, tipLength=0.1, line_type='aa')[source]
Create an image representing a 2D vector field.
- Parameters:
image (ndarray) – image to draw on
dx (ndarray) – grid of vector x components
dy (ndarray) – grid of vector y components
stride (int | float) – sparsity of vectors, int specifies stride step in pixels, a float specifies it as a percentage.
thresh (float) – only plot vectors with magnitude greater than thres
scale (float) – multiply magnitude for easier visualization
alpha (float) – alpha value for vectors. Non-vector regions receive 0 alpha (if False, no alpha channel is used)
color (str | tuple | kwimage.Color) – RGB color of the vectors
thickness (int) – thickness of arrows
tipLength (float) – fraction of line length
line_type (int | str) – either cv2.LINE_4, cv2.LINE_8, or cv2.LINE_AA or ‘aa’
- Returns:
The image with vectors overlaid. If image=None, then an rgb/a image is created and returned.
- Return type:
ndarray[Any, Float32]
Example
>>> from kwimage.im_draw import *  # NOQA
>>> import kwimage
>>> width, height = 512, 512
>>> image = kwimage.grab_test_image(dsize=(width, height))
>>> x, y = np.meshgrid(np.arange(height), np.arange(width))
>>> dx, dy = x - width / 2, y - height / 2
>>> radians = np.arctan2(dx, dy)
>>> mag = np.sqrt(dx ** 2 + dy ** 2) + 1e-3
>>> dx, dy = dx / mag, dy / mag
>>> img = kwimage.draw_vector_field(image, dx, dy, scale=10, alpha=False)
>>> # xdoctest: +REQUIRES(--show)
>>> import kwplot
>>> kwplot.autompl()
>>> kwplot.imshow(img, title='draw_vector_field')
>>> kwplot.show_if_requested()
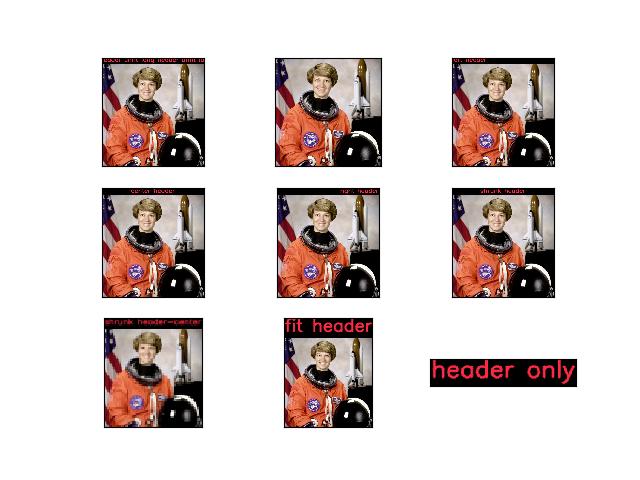
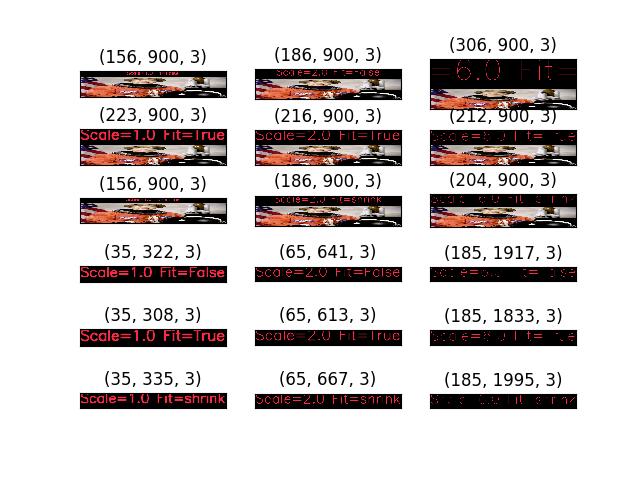
- kwimage.im_draw.draw_header_text(image=None, text=None, fit=False, color='strawberry', halign='center', stack='auto', bg_color='black', **kwargs)[source]
Places a black bar on top of an image and writes text in it
- Parameters:
image (ndarray | dict | None) – numpy image or dictionary containing a key width
text (str) – text to draw
fit (bool | str) – If False, will draw as much text within the given width as possible. If True, will draw all text and then resize to fit in the given width If “shrink”, will only resize the text if it is too big to fit, in other words this is like fit=True, but it wont enlarge the text.
color (str | Tuple) – a color coercable to
kwimage.Color.halign (str) – Horizontal alignment. Can be left, center, or right.
stack (bool | str) – if True returns the stacked image, otherwise just returns the header. If ‘auto’, will only stack if an image is given as an ndarray.
**kwargs – used only for parameter aliases. Currently accepts:
bg_value as an alias for bg_color.
fontScale
fontFace
thickness
- Returns:
ndarray
Example
>>> from kwimage.im_draw import *  # NOQA
>>> import kwimage
>>> image = kwimage.grab_test_image()
>>> tiny_image = kwimage.imresize(image, dsize=(64, 64))
>>> canvases = []
>>> canvases += [draw_header_text(image=image, text='unfit long header ' * 5, fit=False)]
>>> canvases += [draw_header_text(image=image, text='shrunk long header ' * 5, fit='shrink')]
>>> canvases += [draw_header_text(image=image, text='left header', fit=False, halign='left')]
>>> canvases += [draw_header_text(image=image, text='center header', fit=False, halign='center')]
>>> canvases += [draw_header_text(image=image, text='right header', fit=False, halign='right')]
>>> canvases += [draw_header_text(image=image, text='shrunk header', fit='shrink', halign='left')]
>>> canvases += [draw_header_text(image=tiny_image, text='shrunk header-center', fit='shrink', halign='center')]
>>> canvases += [draw_header_text(image=image, text='fit header', fit=True, halign='left')]
>>> canvases += [draw_header_text(image={'width': 200}, text='header only', fit=True, halign='left')]
>>> # xdoctest: +REQUIRES(--show)
>>> import kwplot
>>> kwplot.autompl()
>>> pnum_ = kwplot.PlotNums(nCols=3, nSubplots=len(canvases))
>>> for c in canvases:
>>>     kwplot.imshow(c, pnum=pnum_())
>>> kwplot.show_if_requested()
Example
>>> # Test fontScale
>>> from kwimage.im_draw import *  # NOQA
>>> import kwimage
>>> test_image = kwimage.grab_test_image(dsize=(900, 120))
>>> canvases = []
>>> for image in [test_image, None]:
>>>     canvases += [draw_header_text(image=image, text='Scale=1.0 Fit=False', fit=False, fontScale=1.0)]
>>>     canvases += [draw_header_text(image=image, text='Scale=2.0 Fit=False', fit=False, fontScale=2.0)]
>>>     canvases += [draw_header_text(image=image, text='Scale=6.0 Fit=False', fit=False, fontScale=6.0)]
>>>     canvases += [draw_header_text(image=image, text='Scale=1.0 Fit=True', fit=True, fontScale=1.0)]
>>>     canvases += [draw_header_text(image=image, text='Scale=2.0 Fit=True', fit=True, fontScale=2.0)]
>>>     canvases += [draw_header_text(image=image, text='Scale=6.0 Fit=True', fit=True, fontScale=6.0)]
>>>     canvases += [draw_header_text(image=image, text='Scale=1.0 Fit=shrink', fit='shrink', fontScale=1.0)]
>>>     canvases += [draw_header_text(image=image, text='Scale=2.0 Fit=shrink', fit='shrink', fontScale=2.0)]
>>>     canvases += [draw_header_text(image=image, text='Scale=6.0 Fit=shrink', fit='shrink', fontScale=6.0)]
>>> # xdoctest: +REQUIRES(--show)
>>> import kwplot
>>> kwplot.autompl()
>>> pnum_ = kwplot.PlotNums(nCols=3, nSubplots=len(canvases))
>>> for c in canvases:
>>>     kwplot.imshow(c, pnum=pnum_(), title=str(c.shape))
>>> kwplot.show_if_requested()
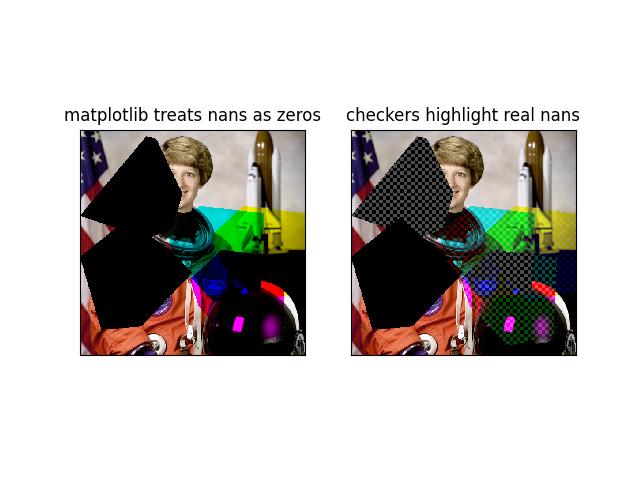
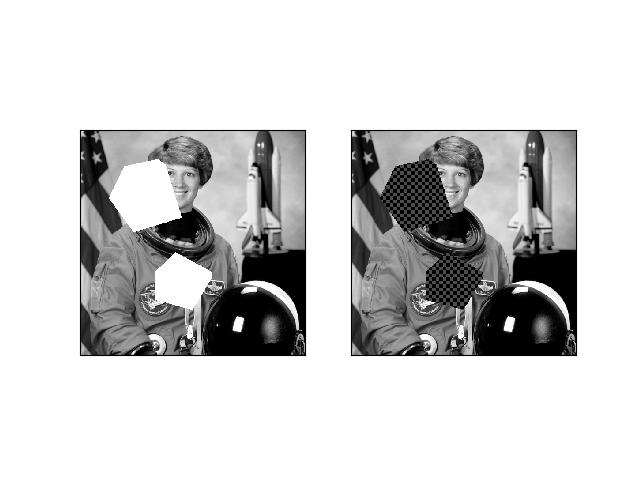
- kwimage.im_draw.fill_nans_with_checkers(canvas, square_shape=8, on_value='auto', off_value='auto')[source]
Fills nan or masked values with a 2d checkerboard pattern.
- Parameters:
canvas (np.ndarray) – data replace nans in
square_shape (int | Tuple[int, int] | str) – Size of the checker squares. Defaults to 8.
on_value (Number | str) – The value of one checker. Defaults to a dark-gray color, 0.3 for floats and 77 for ints.
off_value (Number | str) – The value off the other checker. Defaults to black, which is 0.
- Returns:
the inplace modified canvas
- Return type:
np.ndarray
- SeeAlso:
nodata_checkerboard()- similar, but operates on nans or masked arrays.
Example
>>> from kwimage.im_draw import *  # NOQA
>>> import kwimage
>>> orig_img = kwimage.ensure_float01(kwimage.grab_test_image())
>>> poly1 = kwimage.Polygon.random(rng=1).scale(orig_img.shape[0] // 2)
>>> poly2 = kwimage.Polygon.random(rng=3).scale(orig_img.shape[0])
>>> poly3 = kwimage.Polygon.random(rng=4).scale(orig_img.shape[0] // 2)
>>> poly3 = poly3.translate((0, 200))
>>> poly4 = poly2.translate((100, 0))
>>> poly5 = poly2.translate((50, 100))
>>> img = orig_img.copy()
>>> img = poly1.fill(img, np.nan)
>>> img = poly3.fill(img, 0)
>>> img[:, :, 0] = poly2.fill(np.ascontiguousarray(img[:, :, 0]), np.nan)
>>> img[:, :, 2] = poly4.fill(np.ascontiguousarray(img[:, :, 2]), np.nan)
>>> img[:, :, 1] = poly5.fill(np.ascontiguousarray(img[:, :, 1]), np.nan)
>>> input_img = img.copy()
>>> canvas = fill_nans_with_checkers(input_img, on_value=0.3)
>>> assert input_img is canvas
>>> # xdoctest: +REQUIRES(--show)
>>> import kwplot
>>> kwplot.autompl()
>>> kwplot.imshow(img, pnum=(1, 2, 1), title='matplotlib treats nans as zeros')
>>> kwplot.imshow(canvas, pnum=(1, 2, 2), title='checkers highlight real nans')
Example
>>> # Test grayscale
>>> from kwimage.im_draw import *  # NOQA
>>> import kwimage
>>> orig_img = kwimage.ensure_float01(kwimage.grab_test_image())
>>> poly1 = kwimage.Polygon.random().scale(orig_img.shape[0] // 2)
>>> poly2 = kwimage.Polygon.random().scale(orig_img.shape[0])
>>> img = orig_img.copy()
>>> img = poly1.fill(img, np.nan)
>>> img[:, :, 0] = poly2.fill(np.ascontiguousarray(img[:, :, 0]), np.nan)
>>> img = kwimage.convert_colorspace(img, 'rgb', 'gray')
>>> canvas = img.copy()
>>> canvas = fill_nans_with_checkers(canvas)
>>> # xdoctest: +REQUIRES(--show)
>>> import kwplot
>>> kwplot.autompl()
>>> kwplot.imshow(img, pnum=(1, 2, 1))
>>> kwplot.imshow(canvas, pnum=(1, 2, 2))
- kwimage.im_draw._masked_checkerboard(canvas, invalid_mask, square_shape, on_value, off_value)[source]
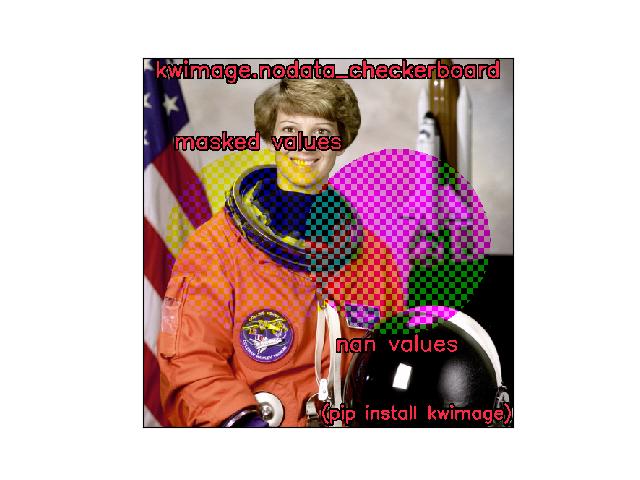
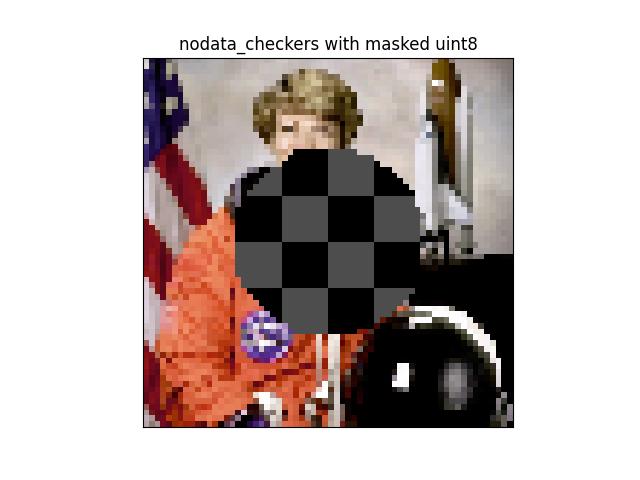
- kwimage.im_draw.nodata_checkerboard(canvas, square_shape=8, on_value='auto', off_value='auto')[source]
Fills nans or masked values with a checkerbord pattern.
- Parameters:
canvas (ndarray) – A 2D image with any number of channels that may be a masked array or contain nan values.
square_shape (int) – the pixel size of the checkers
on_value (Number | str) – The value of one checker. Defaults to 1 for floats and 255 for ints.
off_value (Number | str) – The value off the other checker. Defaults to 0.
- Returns:
- an output array with imputed values.
if the input was a masked array, the mask will still exist.
- Return type:
ndarray
- SeeAlso:
fill_nans_with_checkers()- similar, but only operates on nan values.
Example
>>> import kwimage
>>> # Test a masked array WITH nan values
>>> data = kwimage.grab_test_image(space='rgb')
>>> na_circle = kwimage.Polygon.circle((256 - 96, 256), 128)
>>> ma_circle = kwimage.Polygon.circle((256 + 96, 256), 128)
>>> ma_mask = na_circle.fill(np.zeros(data.shape, dtype=np.uint8), value=1).astype(bool)
>>> na_mask = ma_circle.fill(np.zeros(data.shape, dtype=np.uint8), value=1).astype(bool)
>>> # Hack the channels to make a ven diagram
>>> ma_mask[..., [0, 1]] = False
>>> na_mask[..., [0, 2]] = False
>>> data = kwimage.ensure_float01(data)
>>> data[na_mask] = np.nan
>>> canvas = np.ma.MaskedArray(data, ma_mask)
>>> kwimage.draw_text_on_image(canvas, 'masked values', (256 - 96, 256 - 128), halign='center', valign='bottom', border=2)
>>> kwimage.draw_text_on_image(canvas, 'nan values',    (256 + 96, 256 + 128), halign='center', valign='top', border=2)
>>> kwimage.draw_text_on_image(canvas, 'kwimage.nodata_checkerboard',    (256, 5), halign='center', valign='top', border=2)
>>> kwimage.draw_text_on_image(canvas, '(pip install kwimage)', (512, 512 - 10), halign='right', valign='bottom', border=2, fontScale=0.8)
>>> result = kwimage.nodata_checkerboard(canvas, on_value=0.5)
>>> # xdoctest: +REQUIRES(--show)
>>> import kwplot
>>> kwplot.autompl()
>>> kwplot.imshow(result)
>>> kwplot.show_if_requested()
Example
>>> # Simple test with a masked array
>>> import kwimage
>>> data = kwimage.grab_test_image(space='rgb', dsize=(64, 64))
>>> data = kwimage.ensure_uint255(data)
>>> circle = kwimage.Polygon.circle((32, 32), 16)
>>> mask = circle.fill(np.zeros(data.shape, dtype=np.uint8), value=1).astype(bool)
>>> img = np.ma.MaskedArray(data, mask)
>>> canvas = img.copy()
>>> result = kwimage.nodata_checkerboard(canvas)
>>> canvas.data is result.data
>>> # xdoctest: +REQUIRES(--show)
>>> import kwplot
>>> kwplot.autompl()
>>> kwplot.imshow(result, title='nodata_checkers with masked uint8')
>>> kwplot.show_if_requested()
Example
>>> # Simple test with a bad mask
>>> import kwimage
>>> data = kwimage.grab_test_image(space='rgb', dsize=(64, 64))
>>> data = kwimage.ensure_uint255(data)
>>> circle = kwimage.Polygon.circle((32, 32), 16)
>>> mask = circle.fill(np.zeros(data.shape, dtype=np.uint8), value=1).astype(bool)
>>> img = np.ma.MaskedArray(data, mask)
>>> img.__dict__['_mask'] = np.empty((), dtype=bool)
>>> import pytest
>>> with pytest.raises(Exception):
...     result = kwimage.nodata_checkerboard(img)