kwimage.im_filter module
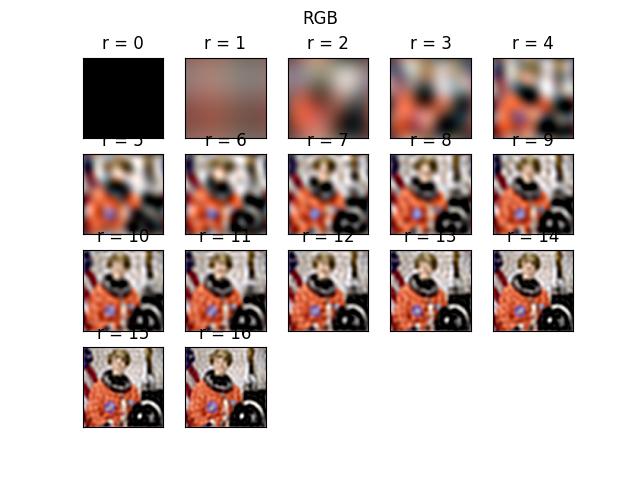
- kwimage.im_filter.radial_fourier_mask(img_hwc, radius=11, axis=None, clip=None)[source]
In [1] they use a radius of 11.0 on CIFAR-10.
- Parameters:
img_hwc (ndarray) – assumed to be float 01
References
[1] Jo and Bengio “Measuring the tendency of CNNs to Learn Surface Statistical Regularities” 2017. https://docs.opencv.org/3.0-beta/doc/py_tutorials/py_imgproc/py_transforms/py_fourier_transform/py_fourier_transform.html
Example
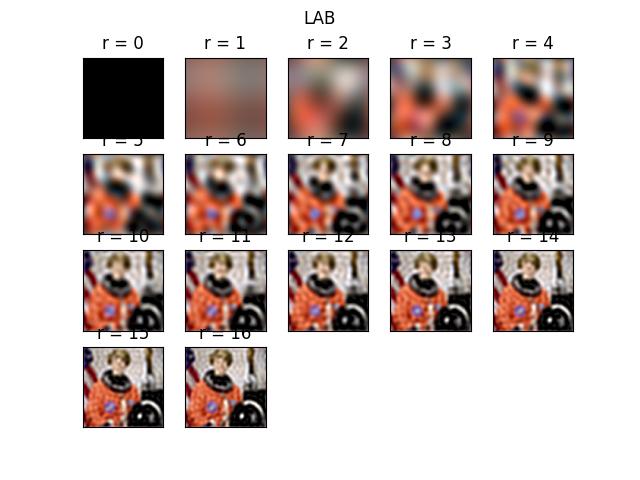
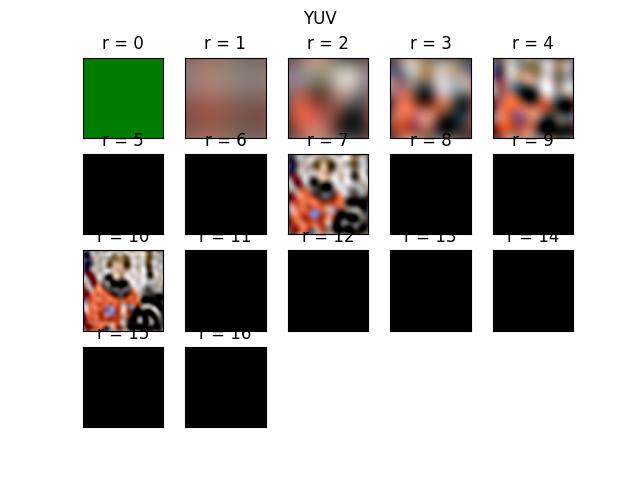
>>> from kwimage.im_filter import *  # NOQA
>>> import kwimage
>>> img_hwc = kwimage.grab_test_image()
>>> img_hwc = kwimage.ensure_float01(img_hwc)
>>> out_hwc = radial_fourier_mask(img_hwc, radius=11)
>>> # xdoctest: REQUIRES(--show)
>>> import kwplot
>>> plt = kwplot.autoplt()
>>> def keepdim(func):
>>>     def _wrap(im):
>>>         needs_transpose = (im.shape[0] == 3)
>>>         if needs_transpose:
>>>             im = im.transpose(1, 2, 0)
>>>         out = func(im)
>>>         if needs_transpose:
>>>             out = out.transpose(2, 0, 1)
>>>         return out
>>>     return _wrap
>>> @keepdim
>>> def rgb_to_lab(im):
>>>     return kwimage.convert_colorspace(im, src_space='rgb', dst_space='lab')
>>> @keepdim
>>> def lab_to_rgb(im):
>>>     return kwimage.convert_colorspace(im, src_space='lab', dst_space='rgb')
>>> @keepdim
>>> def rgb_to_yuv(im):
>>>     return kwimage.convert_colorspace(im, src_space='rgb', dst_space='yuv')
>>> @keepdim
>>> def yuv_to_rgb(im):
>>>     return kwimage.convert_colorspace(im, src_space='yuv', dst_space='rgb')
>>> def show_data(img_hwc):
>>>     # dpath = ub.ensuredir('./fouriertest')
>>>     kwplot.imshow(img_hwc, fnum=1)
>>>     pnum_ = kwplot.PlotNums(nRows=4, nCols=5)
>>>     for r in range(0, 17):
>>>         imgt = radial_fourier_mask(img_hwc, r, clip=(0, 1))
>>>         kwplot.imshow(imgt, pnum=pnum_(), fnum=2)
>>>         plt.gca().set_title('r = {}'.format(r))
>>>     kwplot.set_figtitle('RGB')
>>>     # plt.gcf().savefig(join(dpath, '{}_{:08d}.png'.format('rgb', x)))
>>>     pnum_ = kwplot.PlotNums(nRows=4, nCols=5)
>>>     for r in range(0, 17):
>>>         imgt = lab_to_rgb(radial_fourier_mask(rgb_to_lab(img_hwc), r))
>>>         kwplot.imshow(imgt, pnum=pnum_(), fnum=3)
>>>         plt.gca().set_title('r = {}'.format(r))
>>>     kwplot.set_figtitle('LAB')
>>>     # plt.gcf().savefig(join(dpath, '{}_{:08d}.png'.format('lab', x)))
>>>     pnum_ = kwplot.PlotNums(nRows=4, nCols=5)
>>>     for r in range(0, 17):
>>>         imgt = yuv_to_rgb(radial_fourier_mask(rgb_to_yuv(img_hwc), r))
>>>         kwplot.imshow(imgt, pnum=pnum_(), fnum=4)
>>>         plt.gca().set_title('r = {}'.format(r))
>>>     kwplot.set_figtitle('YUV')
>>>     # plt.gcf().savefig(join(dpath, '{}_{:08d}.png'.format('yuv', x)))
>>> show_data(img_hwc)
>>> kwplot.show_if_requested()
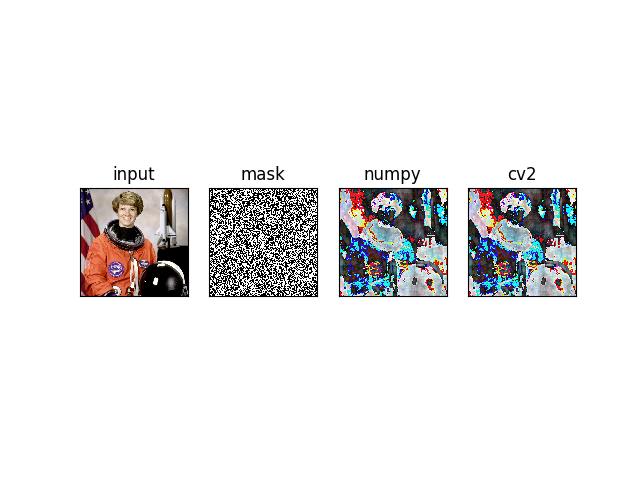
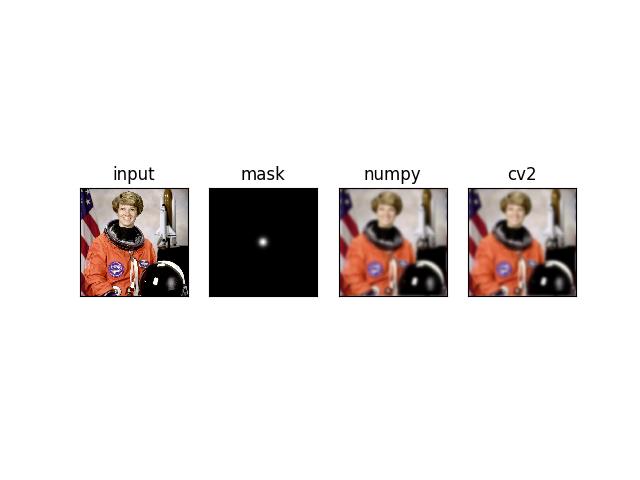
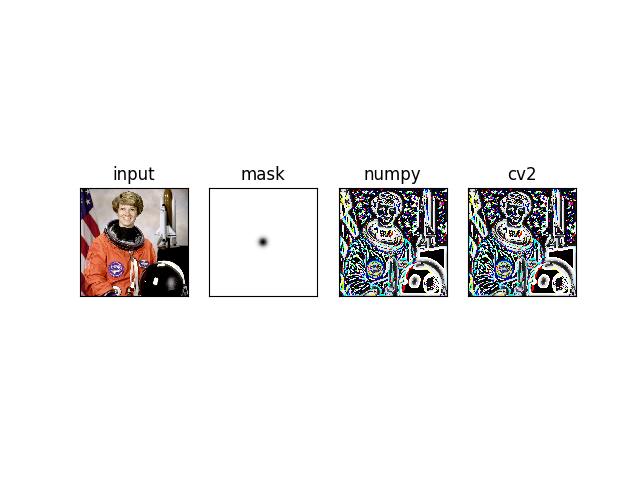
- kwimage.im_filter.fourier_mask(img_hwc, mask, axis=None, clip=None, backend='cv2')[source]
Applies a mask to the fourier spectrum of an image
- Parameters:
img_hwc (ndarray) – assumed to be float 01
mask (ndarray) –
- mask used to modulate the image in the fourier domain.
Usually these are boolean values (hence the name mask), but any numerical value is technically allowed.
- backend (str):
which implementation of DFT to use. Can be ‘cv2’ or ‘numpy’. Defaults to cv2.
CommandLine
XDEV_PROFILE=1 xdoctest -m kwimage.im_filter fourier_mask --show
import kwimage img_hwc = kwimage.grab_test_image(space=’gray’) mask = np.random.rand(*img_hwc.shape[0:2]) out_hwc = fourier_mask(img_hwc, mask) for timer in ti.reset(‘fft mask with numpy’):
- with timer:
fourier_mask(out_hwc, mask, backend=’numpy’)
- for timer in ti.reset(‘fft mask with cv2’):
- with timer:
fourier_mask(out_hwc, mask, backend=’cv2’)
Example
>>> from kwimage.im_filter import *  # NOQA
>>> import kwimage
>>> img_hwc = kwimage.grab_test_image(space='gray')
>>> mask = np.random.rand(*img_hwc.shape[0:2])
>>> mask = (kwimage.gaussian_blur(mask) > 0.5)
>>> out_hwc_cv2 = fourier_mask(img_hwc, mask, backend='numpy')
>>> out_hwc_np = fourier_mask(img_hwc, mask, backend='cv2')
>>> # xdoctest: REQUIRES(--show)
>>> import kwplot
>>> kwplot.autompl()
>>> kwplot.imshow(img_hwc, pnum=(1, 4, 1), fnum=1, title='input')
>>> kwplot.imshow(mask, pnum=(1, 4, 2), fnum=1, title='mask')
>>> kwplot.imshow(out_hwc_cv2, pnum=(1, 4, 3), fnum=1, title='numpy')
>>> kwplot.imshow(out_hwc_np, pnum=(1, 4, 4), fnum=1, title='cv2')
>>> kwplot.show_if_requested()
Example
>>> from kwimage.im_filter import *  # NOQA
>>> import kwimage
>>> img_hwc = kwimage.grab_test_image(space='gray')
>>> mask = kwimage.gaussian_patch(img_hwc.shape[0:2])
>>> mask = (mask / mask.max()) ** 32
>>> out_hwc_cv2 = fourier_mask(img_hwc, mask, backend='numpy')
>>> out_hwc_np = fourier_mask(img_hwc, mask, backend='cv2')
>>> # xdoctest: REQUIRES(--show)
>>> import kwplot
>>> kwplot.autompl()
>>> kwplot.imshow(img_hwc, pnum=(1, 4, 1), fnum=1, title='input')
>>> kwplot.imshow(mask, pnum=(1, 4, 2), fnum=1, title='mask')
>>> kwplot.imshow(out_hwc_cv2, pnum=(1, 4, 3), fnum=1, title='numpy')
>>> kwplot.imshow(out_hwc_np, pnum=(1, 4, 4), fnum=1, title='cv2')
>>> kwplot.show_if_requested()
Example
>>> from kwimage.im_filter import *  # NOQA
>>> import kwimage
>>> img_hwc = kwimage.grab_test_image(space='gray')
>>> mask = kwimage.gaussian_patch(img_hwc.shape[0:2])
>>> mask = 1 - (mask / mask.max()) ** 32
>>> out_hwc_cv2 = fourier_mask(img_hwc, mask, backend='numpy')
>>> out_hwc_np = fourier_mask(img_hwc, mask, backend='cv2')
>>> # xdoctest: REQUIRES(--show)
>>> import kwplot
>>> kwplot.autompl()
>>> kwplot.imshow(img_hwc, pnum=(1, 4, 1), fnum=1, title='input')
>>> kwplot.imshow(mask, pnum=(1, 4, 2), fnum=1, title='mask')
>>> kwplot.imshow(out_hwc_cv2, pnum=(1, 4, 3), fnum=1, title='numpy')
>>> kwplot.imshow(out_hwc_np, pnum=(1, 4, 4), fnum=1, title='cv2')
>>> kwplot.show_if_requested()
- kwimage.im_filter._benchmark()[source]
References
https://docs.opencv.org/4.x/de/dbc/tutorial_py_fourier_transform.html